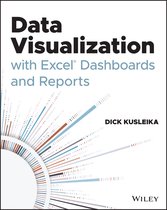
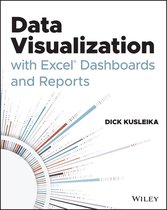
Data Visualization with Excel Dashboards and Reports
Samenvatting
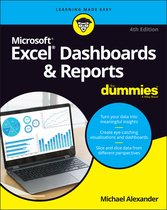
Master the fine art of data visualization with a veteran Excel guru in this up-to-date new resource
While many people can fumble their way through an Excel spreadsheet, how many of those folks can craft compelling and persuasive reports and visualizations from the data contained within? Data Visualization with Excel Dashboards and Reports walks readers through the most meaningful ways to show trends, find and demonstrate relationships in data, and how to make tough and necessary choices when presenting your data to stakeholders so your information has the greatest impact possible.
The accomplished author shows you how to think about your data in ways other than mere columns and rows. It bridges the gap between simply handling data and synthesizing that data into meaningful stories. You’ll learn about how deal with outliers and how to bucket data in the most meaningful way. You’ll learn how to show seemingly impossible amounts of data without inundating and confusing your audience. Finally, you’ll discover how to go from a spreadsheet full of raw data and figures to a high-impact and engaging reports and dashboards that persuade and inform other stakeholders.
Perfect for sales managers, operations analysts, financial officers, administrative assistance, office managers, government employees, and manufacturing managers. Data Visualization with Excel Dashboards and Reports is also an invaluable resource for every professional who works in a data intensive environment.
This unique combination of Excel technical manual and analytical guidebook also offers readers:
Large corporations like IBM and Oracle are using Excel dashboards and reports as a Business Intelligence tool, and many other smaller businesses are looking to these tools in order to cut costs for budgetary reasons. An effective analyst not only has to have the technical skills to use Excel in a productive manner but must be able to synthesize data into a story, and then present that story in the most impactful way. Microsoft shows its recognition of this with Excel. In Excel, there is a major focus on business intelligence and visualization. Data Visualization with Excel Dashboards and Reports fills the gap between handling data and synthesizing data into meaningful reports. This title will show readers how to think about their data in ways other than columns and rows.
Most Excel books do a nice job discussing the individual functions and tools that can be used to create an "Excel Report". Titles on Excel charts, Excel pivot tables, and other books that focus on "Tips and Tricks" are useful in their own right; however they don't hit the mark for most data analysts. The primary reason these titles miss the mark is they are too focused on the mechanical aspects of building a chart, creating a pivot table, or other functionality. They don't offer these topics in the broader picture by showing how to present and report data in the most effective way.
What are the most meaningful ways to show trending? How do you show relationships in data? When is showing variances more valuable than showing actual data values? How do you deal with outliers? How do you bucket data in the most meaningful way? How do you show impossible amounts of data without inundating your audience? In Data Visualization with Excel Reports and Dashboards, readers will get answers to all of these questions. Part technical manual, part analytical guidebook, this title will help Excel users go from reporting data with simple tables full of dull numbers, to creating high-impact reports and dashboards that will wow management both visually and substantively. This book offers a comprehensive review of a wide array of technical and analytical concepts that will help users create meaningful reports and dashboards.
After reading this book, the reader will be able to:
- Analyze large amounts of data and report their data in a meaningful way
- Get better visibility into data from different perspectives
- Quickly slice data into various views on the fly
- Automate redundant reporting and analyses
- Create impressive dashboards and What-If analyses
- Understand the fundamentals of effective visualization
- Visualize performance comparisons
- Visualize changes and trends over time
Productspecificaties
Inhoud
- Taal
- en
- Uitvoering
- Paperback
- Oorspronkelijke releasedatum
- 17 februari 2021
- Aantal pagina's
- 352
- Illustraties
- Nee
Betrokkenen
- Hoofdauteur
- Hoofduitgeverij
Informatie over de fabrikant
- Fabrikant Naam
- Wiley-VCH GmbH
- Fabrikant Adres
- Boschstrasse 12 | 69469| Weinheim| DE
- E-mailadres of online contactformulier van de fabrikant
- product_safety@wiley.com
Overige kenmerken
- Extra groot lettertype
- Nee
- Porno
- Nee
- Product breedte
- 188 mm
- Product hoogte
- 20 mm
- Product lengte
- 234 mm
- Studieboek
- Ja
- Verpakking breedte
- 186 mm
- Verpakking hoogte
- 19 mm
- Verpakking lengte
- 234 mm
- Verpakkingsgewicht
- 688 g
EAN
- EAN
- 9781119698722
Productveiligheid
De verantwoordelijk marktdeelnemer in de EU zorgt voor het nakomen van verplichtingen op het gebied van productveiligheid.
Je vindt dit artikel in
Documenten
Reviews
Kies gewenste uitvoering
Prijs inclusief verzendkosten, verstuurd door bol
Ophalen bij een bol afhaalpunt mogelijk
30 dagen bedenktijd en gratis retourneren via mijn bol
Dag en nacht klantenservice
Doordeweeks ook ’s avonds in huis